Plot position weight matrix or position frequency matrix for different DNA sequence motifs.
Arguments
- object
A Seurat object
- motifs
A list of motif IDs or motif names to plot
- assay
Name of the assay to use
- use.names
Use motif names stored in the motif object
- ...
Additional parameters passed to
ggseqlogo::ggseqlogo()
Value
Returns a ggplot2::ggplot() object
Examples
# \donttest{
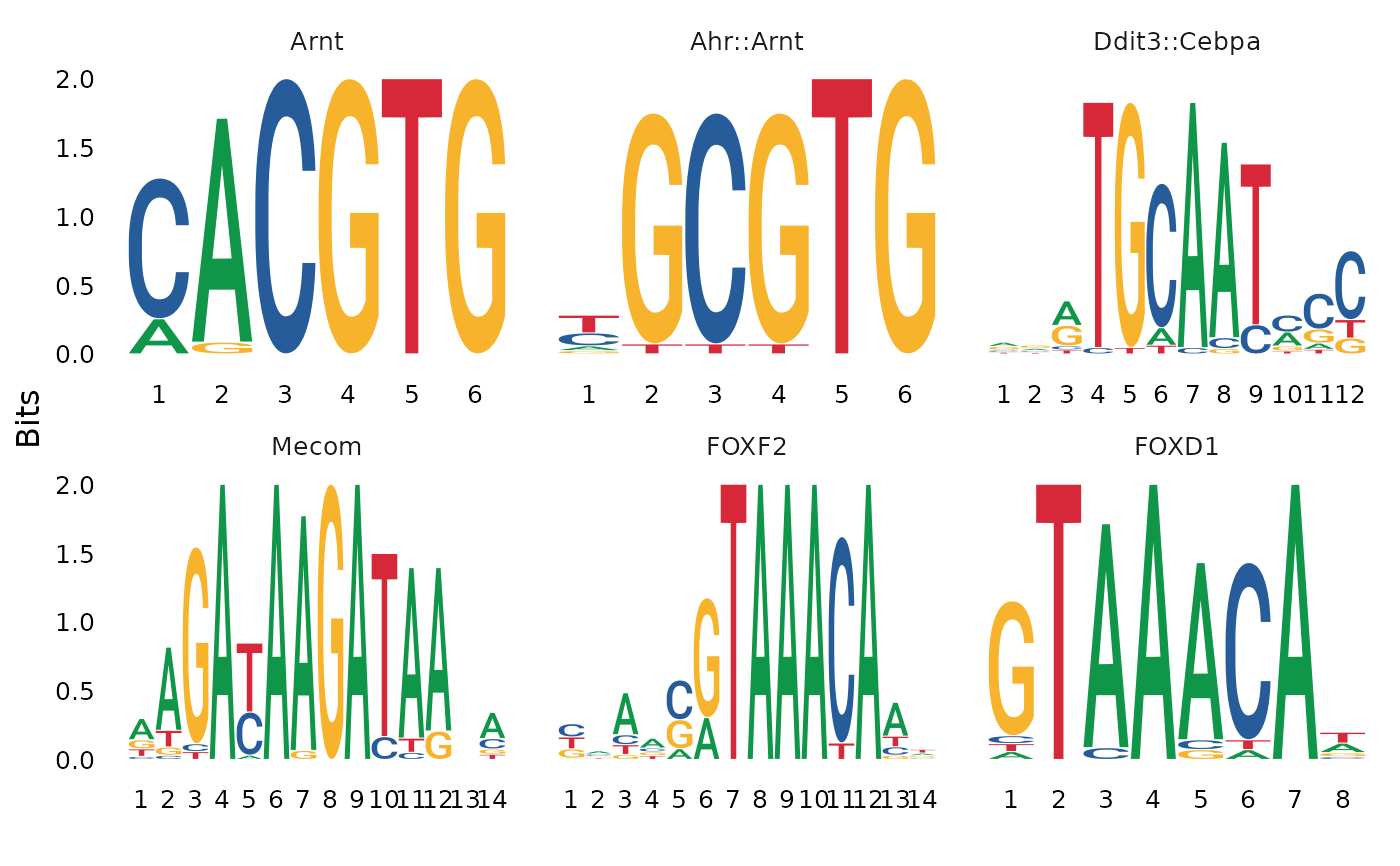
motif.obj <- Motifs(atac_small)
MotifPlot(atac_small, motifs = head(colnames(motif.obj)))
#> Warning: The `<scale>` argument of `guides()` cannot be `FALSE`. Use "none" instead as
#> of ggplot2 3.3.4.
#> ℹ The deprecated feature was likely used in the ggseqlogo package.
#> Please report the issue at <https://github.com/omarwagih/ggseqlogo/issues>.
#> Warning: `aes_string()` was deprecated in ggplot2 3.0.0.
#> ℹ Please use tidy evaluation idioms with `aes()`.
#> ℹ See also `vignette("ggplot2-in-packages")` for more information.
#> ℹ The deprecated feature was likely used in the ggseqlogo package.
#> Please report the issue at <https://github.com/omarwagih/ggseqlogo/issues>.
 # }
# }