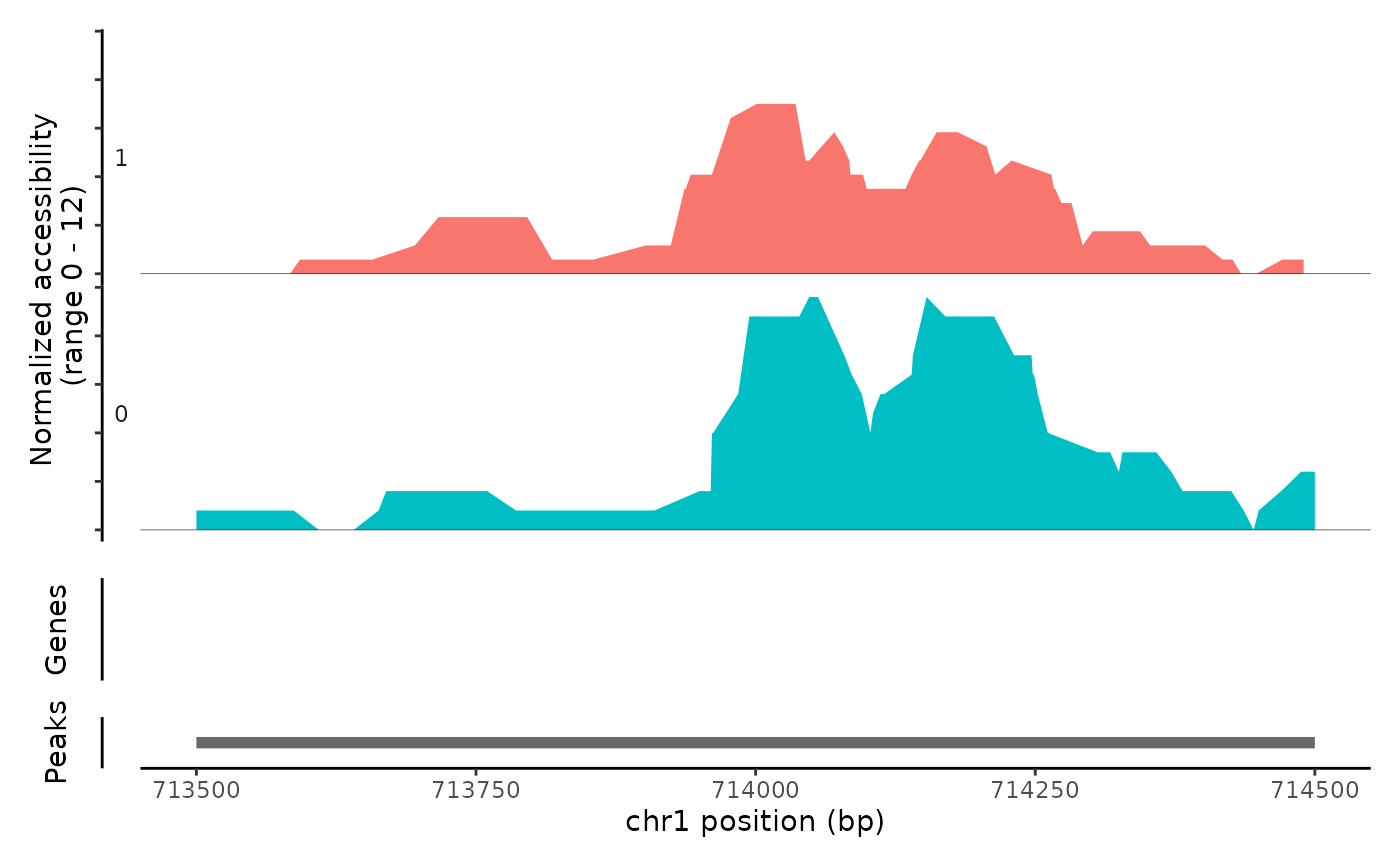
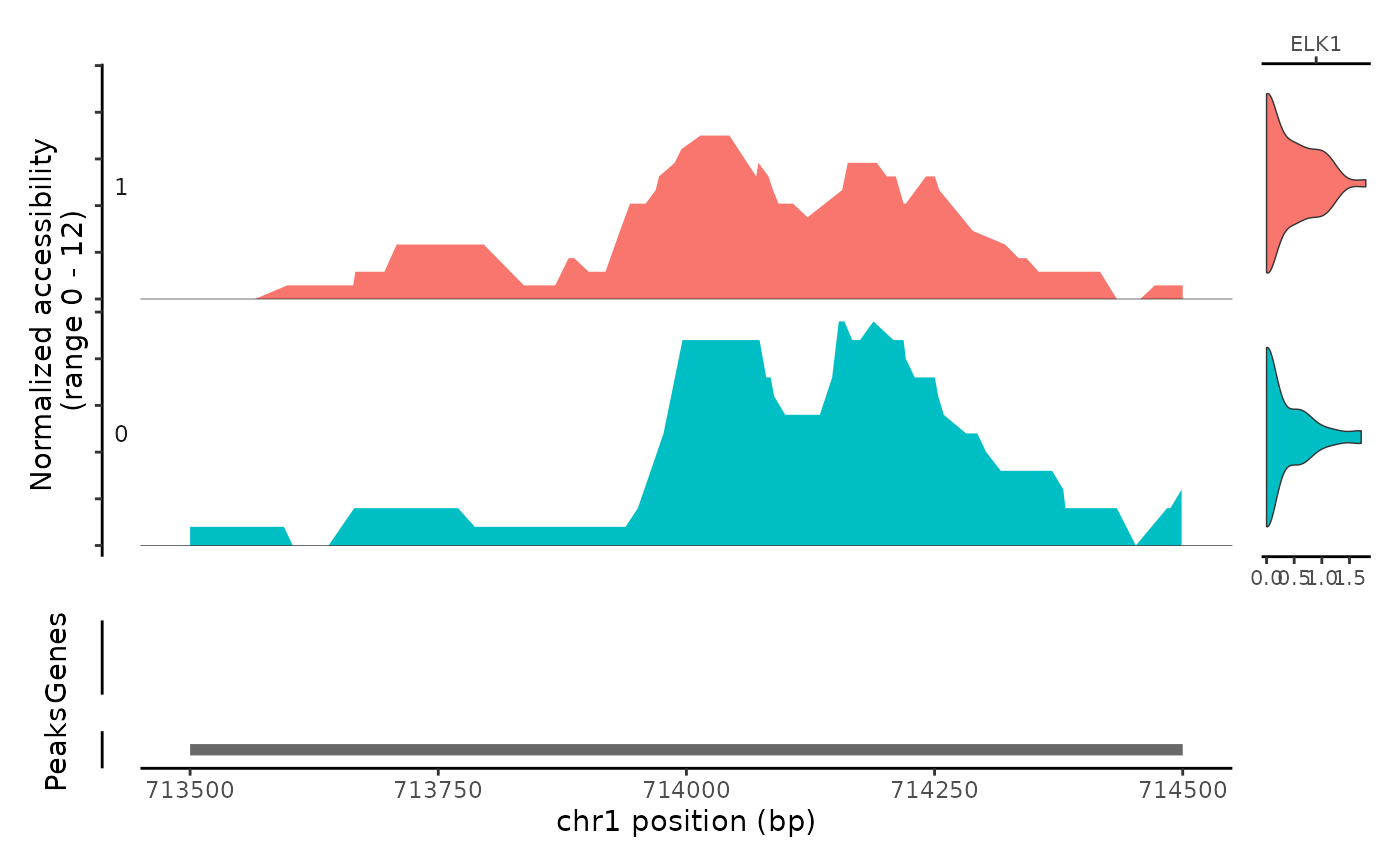
Plot frequency of Tn5 insertion events for different groups of cells within given regions of the genome.
CoveragePlot(
  object,
  region,
  features = NULL,
  assay = NULL,
  show.bulk = FALSE,
  expression.assay = "RNA",
  expression.slot = "data",
  annotation = TRUE,
  peaks = TRUE,
  peaks.group.by = NULL,
  ranges = NULL,
  ranges.group.by = NULL,
  ranges.title = "Ranges",
  region.highlight = NULL,
  links = TRUE,
  tile = FALSE,
  tile.size = 100,
  tile.cells = 100,
  bigwig = NULL,
  bigwig.type = "coverage",
  heights = NULL,
  group.by = NULL,
  window = 100,
  extend.upstream = 0,
  extend.downstream = 0,
  scale.factor = NULL,
  ymax = NULL,
  cells = NULL,
  idents = NULL,
  sep = c("-", "-"),
  max.downsample = 3000,
  downsample.rate = 0.1,
  ...
)
Arguments
| object | A Seurat object |
|---|---|
| region | A set of genomic coordinates to show. Can be a GRanges object, a string encoding a genomic position, a gene name, or a vector of strings describing the genomic coordinates or gene names to plot. If a gene name is supplied, annotations must be present in the assay. |
| features | A vector of features present in another assay to plot alongside accessibility tracks (for example, gene names). |
| assay | Name of the assay to plot |
| show.bulk | Include coverage track for all cells combined (pseudo-bulk). Note that this will plot the combined accessibility for all cells included in the plot (rather than all cells in the object). |
| expression.assay | Name of the assay containing expression data to plot
alongside accessibility tracks. Only needed if supplying |
| expression.slot | Name of slot to pull expression data from. Only needed
if supplying the |
| annotation | Display gene annotations |
| peaks | Display peaks |
| peaks.group.by | Grouping variable to color peaks by. Must be a variable present in the feature metadata. If NULL, do not color peaks by any variable. |
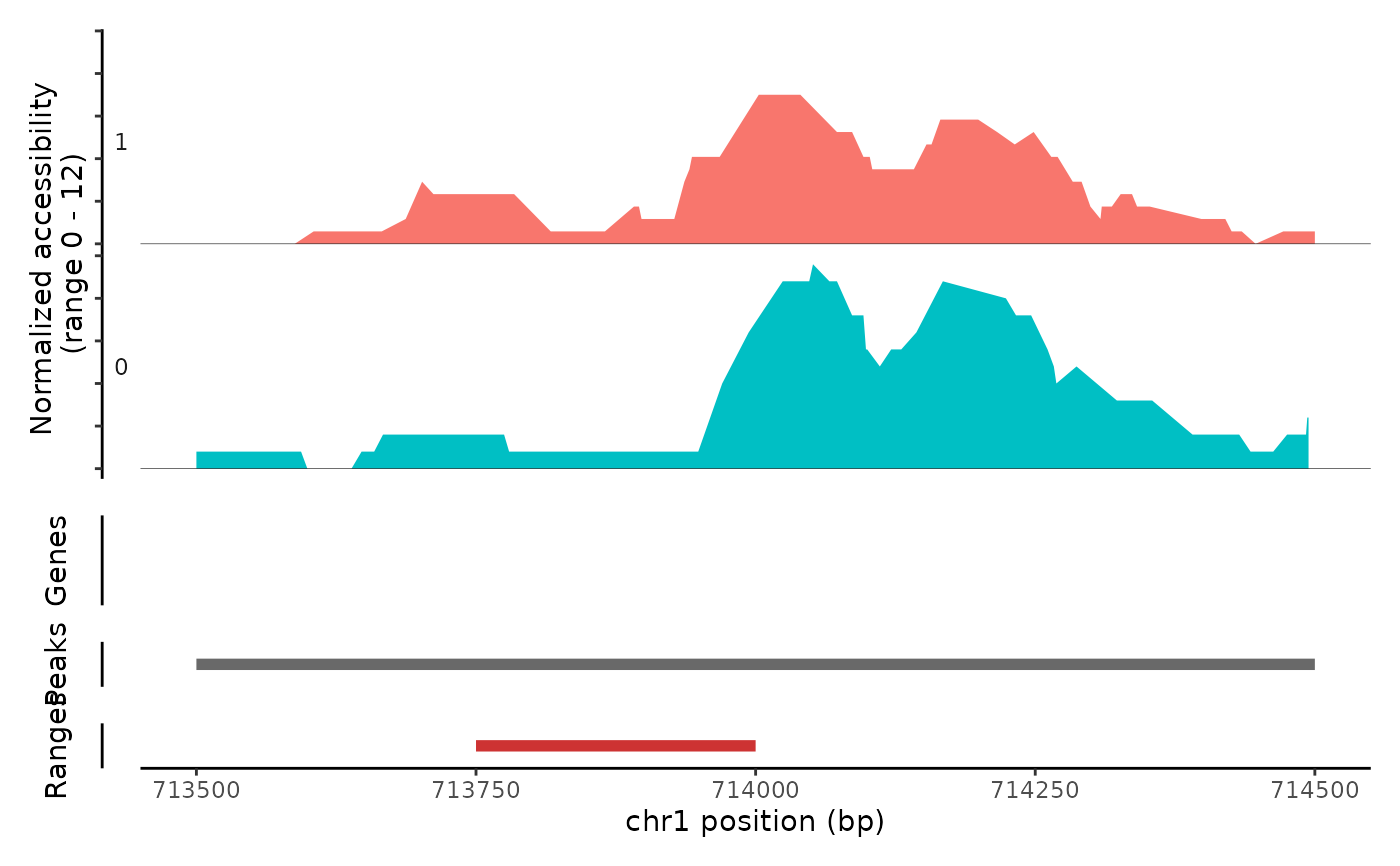
| ranges | Additional genomic ranges to plot |
| ranges.group.by | Grouping variable to color ranges by. Must be a
variable present in the metadata stored in the |
| ranges.title | Y-axis title for ranges track. Only relevant if
|
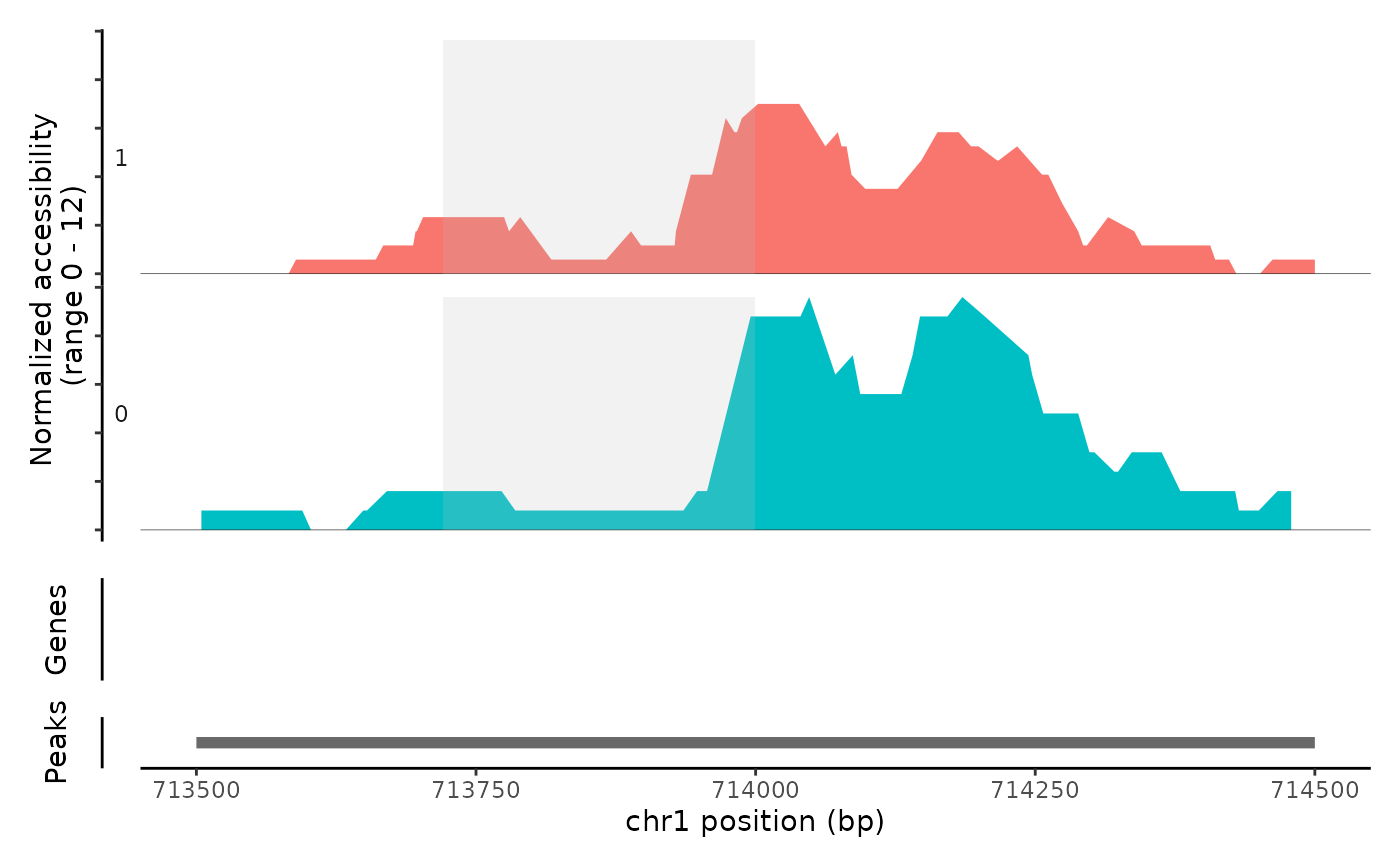
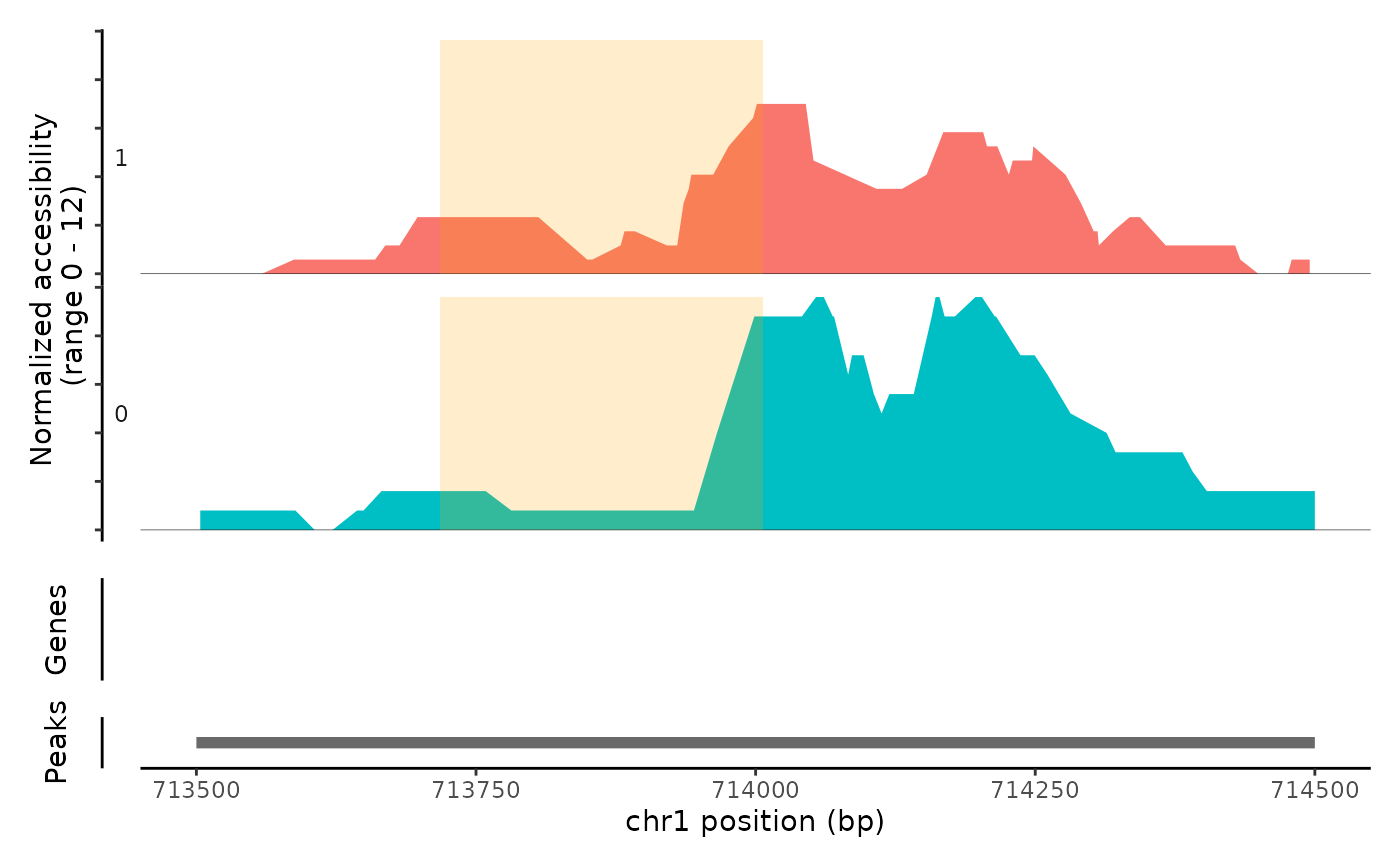
| region.highlight | Region to highlight on the plot. Should be a GRanges object containing the coordinates to highlight. By default, regions will be highlighted in grey. To change the color of the highlighting, include a metadata column in the GRanges object named "color" containing the color to use for each region. |
| links | Display links |
| tile | Display per-cell fragment information in sliding windows. |
| tile.size | Size of the sliding window for per-cell fragment tile plot |
| tile.cells | Number of cells to display fragment information for in tile plot. |
| bigwig | List of bigWig file paths to plot data from. Files can be remotely hosted. The name of each element in the list will determine the y-axis label given to the track. |
| bigwig.type | Type of track to use for bigWig files ("line", "heatmap", or "coverage"). Should either be a single value, or a list of values giving the type for each individual track in the provided list of bigwig files. |
| heights | Relative heights for each track (accessibility, gene annotations, peaks, links). |
| group.by | Name of one or more metadata columns to group (color) the cells by. Default is the current cell identities |
| window | Smoothing window size |
| extend.upstream | Number of bases to extend the region upstream. |
| extend.downstream | Number of bases to extend the region downstream. |
| scale.factor | Scaling factor for track height. If NULL (default), use the median group scaling factor determined by total number of fragments sequences in each group. |
| ymax | Maximum value for Y axis. If NULL (default) set to the highest value among all the tracks. |
| cells | Which cells to plot. Default all cells |
| idents | Which identities to include in the plot. Default is all identities. |
| sep | Separators to use for strings encoding genomic coordinates. First element is used to separate the chromosome from the coordinates, second element is used to separate the start from end coordinate. |
| max.downsample | Minimum number of positions kept when downsampling. Downsampling rate is adaptive to the window size, but this parameter will set the minimum possible number of positions to include so that plots do not become too sparse when the window size is small. |
| downsample.rate | Fraction of positions to retain when downsampling. Retaining more positions can give a higher-resolution plot but can make the number of points large, resulting in larger file sizes when saving the plot and a longer period of time needed to draw the plot. |
| ... | Additional arguments passed to |
Value
Returns a ggplot object
Details
Thanks to Andrew Hill for providing an early version of this function.
Examples
# \donttest{ fpath <- system.file("extdata", "fragments.tsv.gz", package="Signac") fragments <- CreateFragmentObject( path = fpath, cells = colnames(atac_small), validate.fragments = FALSE )#>Fragments(atac_small) <- fragments # Basic coverage plot CoveragePlot(object = atac_small, region = c("chr1-713500-714500"))# Show additional ranges ranges.show <- StringToGRanges("chr1-713750-714000") CoveragePlot(object = atac_small, region = c("chr1-713500-714500"), ranges = ranges.show)# Highlight region CoveragePlot(object = atac_small, region = c("chr1-713500-714500"), region.highlight = ranges.show)# Change highlight color ranges.show$color <- "orange" CoveragePlot(object = atac_small, region = c("chr1-713500-714500"), region.highlight = ranges.show)# Show expression data CoveragePlot(object = atac_small, region = c("chr1-713500-714500"), features = "ELK1")# }
