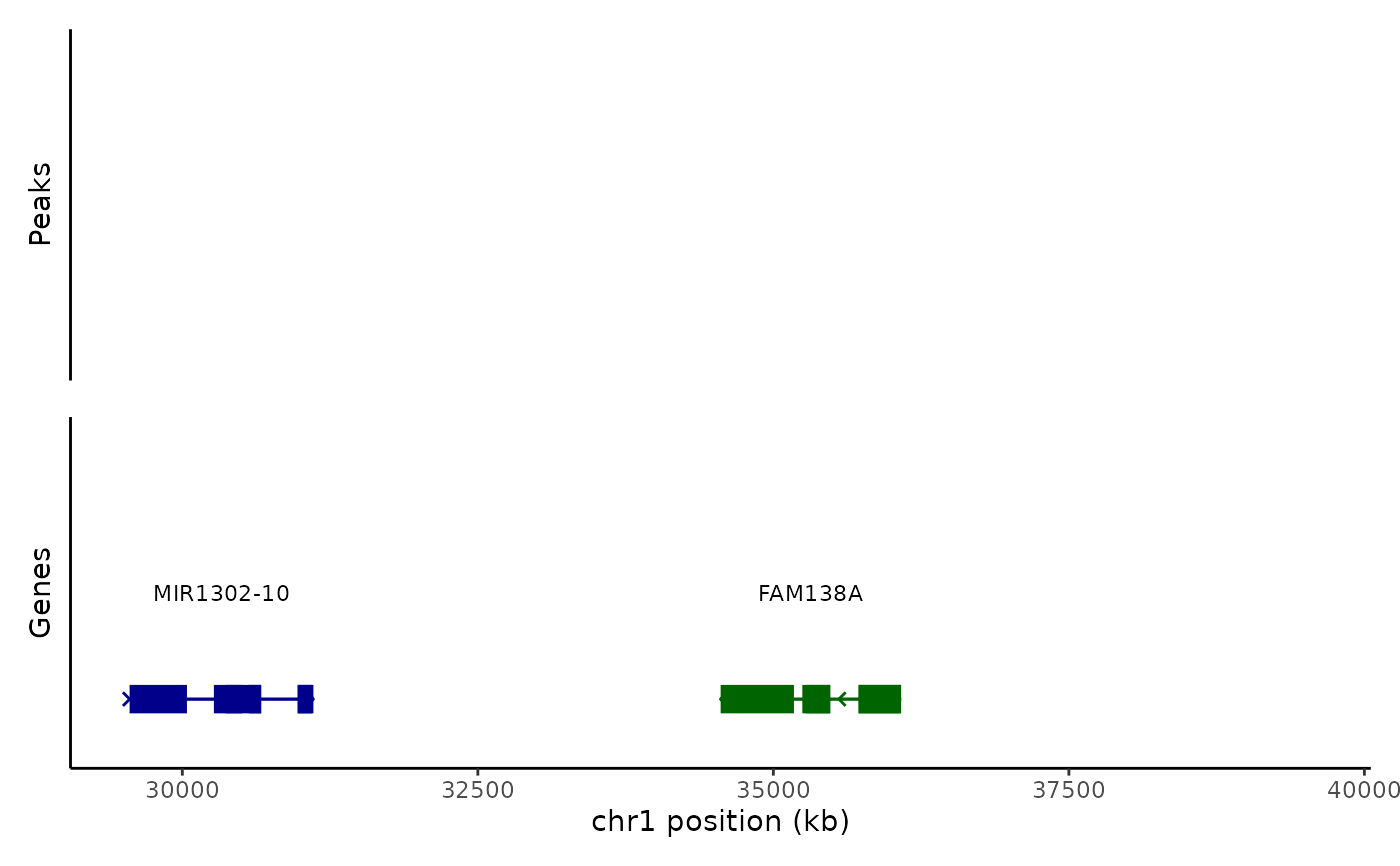
This can be used to combine coverage plots, peak region plots, gene annotation plots, and linked element plots. The different tracks are stacked on top of each other and the x-axis combined.
CombineTracks(plotlist, expression.plot = NULL, heights = NULL, widths = NULL)
Arguments
| plotlist | A list of plots to combine. Must be from the same genomic region. |
|---|---|
| expression.plot | Plot containing gene expression information. If supplied, this will be placed to the left of the coverage tracks and aligned with each track |
| heights | Relative heights for each plot. If NULL, the first plot will be 8x the height of the other tracks. |
| widths | Relative widths for each plot. Only required if adding a gene expression panel. If NULL, main plots will be 8x the width of the gene expression panel |
Value
Returns a patchworked ggplot2 object
Examples
# \donttest{ p1 <- PeakPlot(atac_small, region = "chr1-29554-39554") p2 <- AnnotationPlot(atac_small, region = "chr1-29554-39554") CombineTracks(plotlist = list(p1, p2), heights = c(1, 1))# }
