Display the genomic ranges in a GRangesAssay object that fall in a given genomic region
Usage
PeakPlot(
  object,
  region,
  assay = NULL,
  peaks = NULL,
  group.by = NULL,
  color = "dimgrey",
  extend.upstream = 0,
  extend.downstream = 0
)
Arguments
- object
A
SeuratObject::Seurat()object- region
A genomic region to plot
- assay
Name of assay to use. If NULL, use the default assay.
- peaks
A GRanges object containing peak coordinates. If NULL, use coordinates stored in the Seurat object.
- group.by
Name of variable in feature metadata (if using ranges in the Seurat object) or genomic ranges metadata (if using supplied ranges) to color ranges by. If NULL, do not color by any metadata variable.
- color
Color to use. If
group.byis not NULL, this can be a custom color scale (see examples).- extend.upstream
Number of bases to extend the region upstream.
- extend.downstream
Number of bases to extend the region downstream.
Value
Returns a ggplot2::ggplot() object
Examples
# \donttest{
# plot peaks in assay
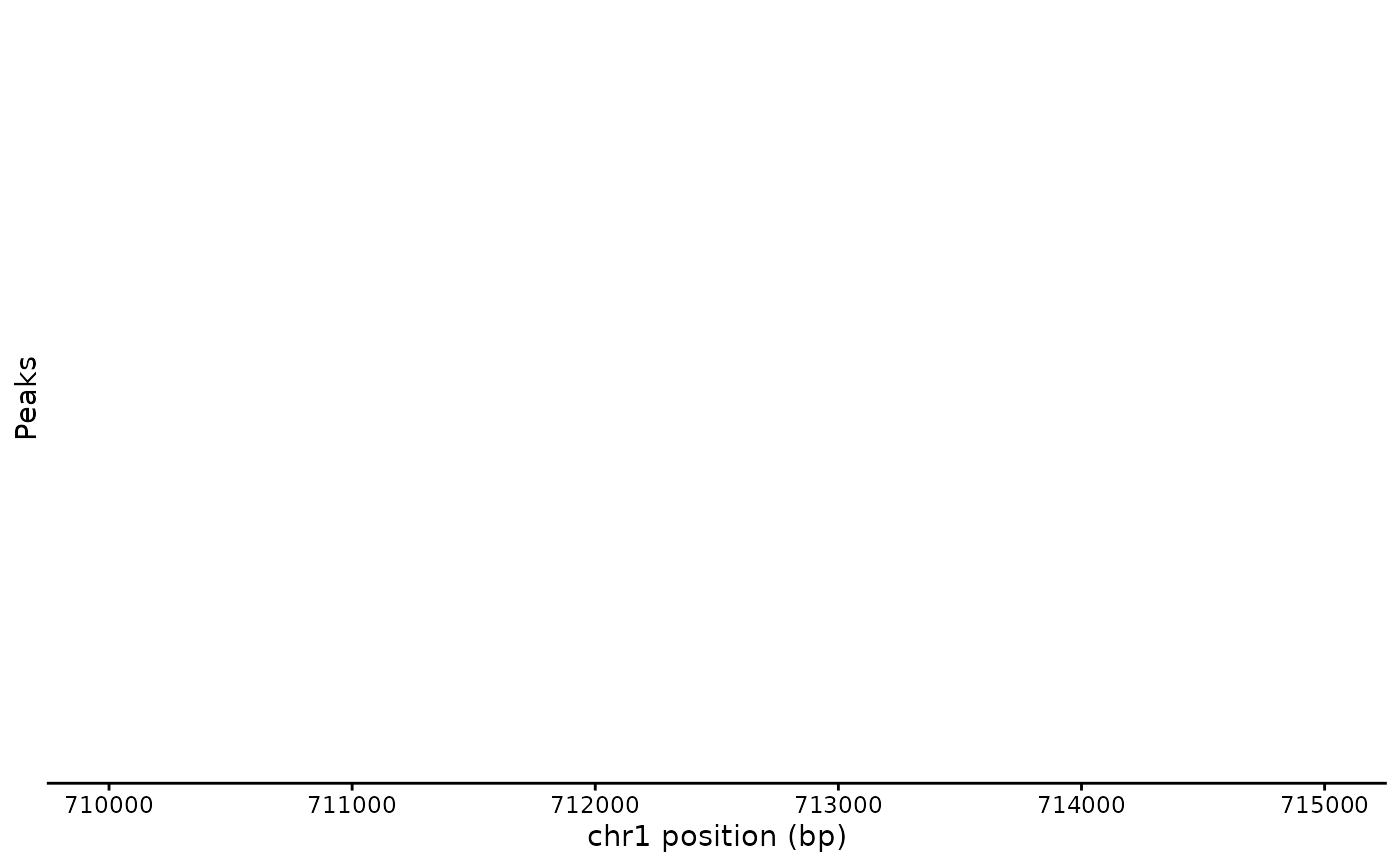
PeakPlot(atac_small, region = "chr1:710000-715000")
 # manually set color
PeakPlot(atac_small, region = "chr1:710000-715000", color = "red")
# manually set color
PeakPlot(atac_small, region = "chr1:710000-715000", color = "red")
 # color by a variable in the feature metadata
PeakPlot(atac_small, region = "chr1:710000-715000", group.by = "count")
# color by a variable in the feature metadata
PeakPlot(atac_small, region = "chr1:710000-715000", group.by = "count")
 # }
# }