
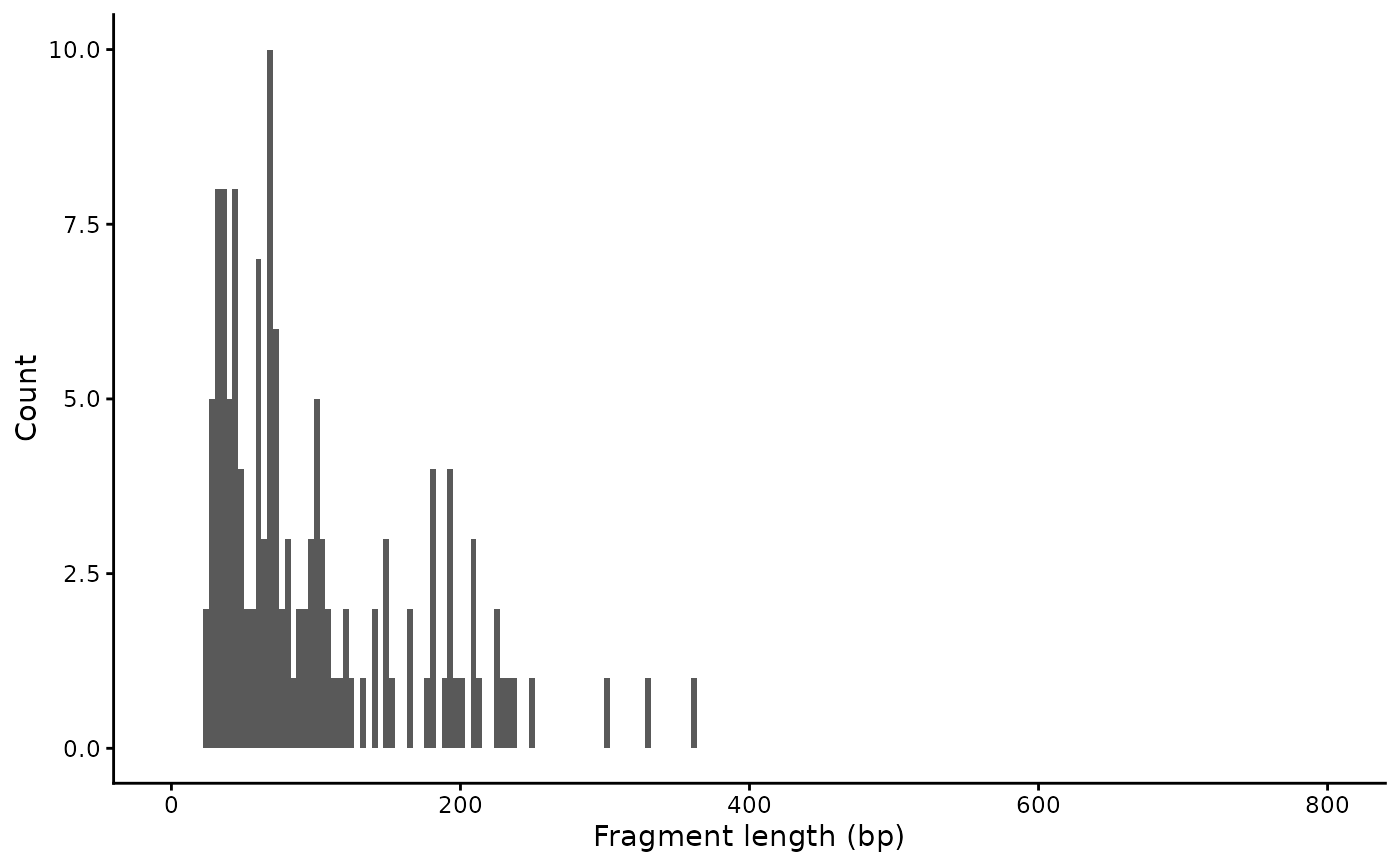
Plot the frequency that fragments of different lengths are present for different groups of cells.
Usage
FragmentHistogram(
  object,
  assay = NULL,
  region = "chr1:1-2000000",
  group.by = NULL,
  cells = NULL,
  log.scale = FALSE,
  max.length = 800,
  ...
)
Arguments
- object
A Seurat object
- assay
Which assay to use. Default is the active assay.
- region
Genomic range to use. Default is fist two megabases of chromosome 1. Can be a GRanges object, a string, or a vector of strings.
- group.by
Name of one or more metadata columns to group (color) the cells by. Default is the current cell identities
- cells
Which cells to plot. Default all cells
- log.scale
Display Y-axis on log scale. Default is FALSE.
- max.length
Maximum fragment length to display. Fragments longer than this are not shown. If
NULL, show all fragment lengths present.- ...
Arguments passed to other functions
Value
Returns a ggplot2::ggplot() object
Examples
# \donttest{
fpath <- system.file("extdata", "fragments.tsv.gz", package = "Signac")
Fragments(atac_small) <- CreateFragmentObject(
path = fpath,
cells = colnames(atac_small),
validate.fragments = FALSE
)
#> Computing hash
FragmentHistogram(object = atac_small, region = "chr1:10245-780007")
#> Warning: Removed 2 rows containing missing values or values outside the scale range
#> (`geom_bar()`).
 # }
# }