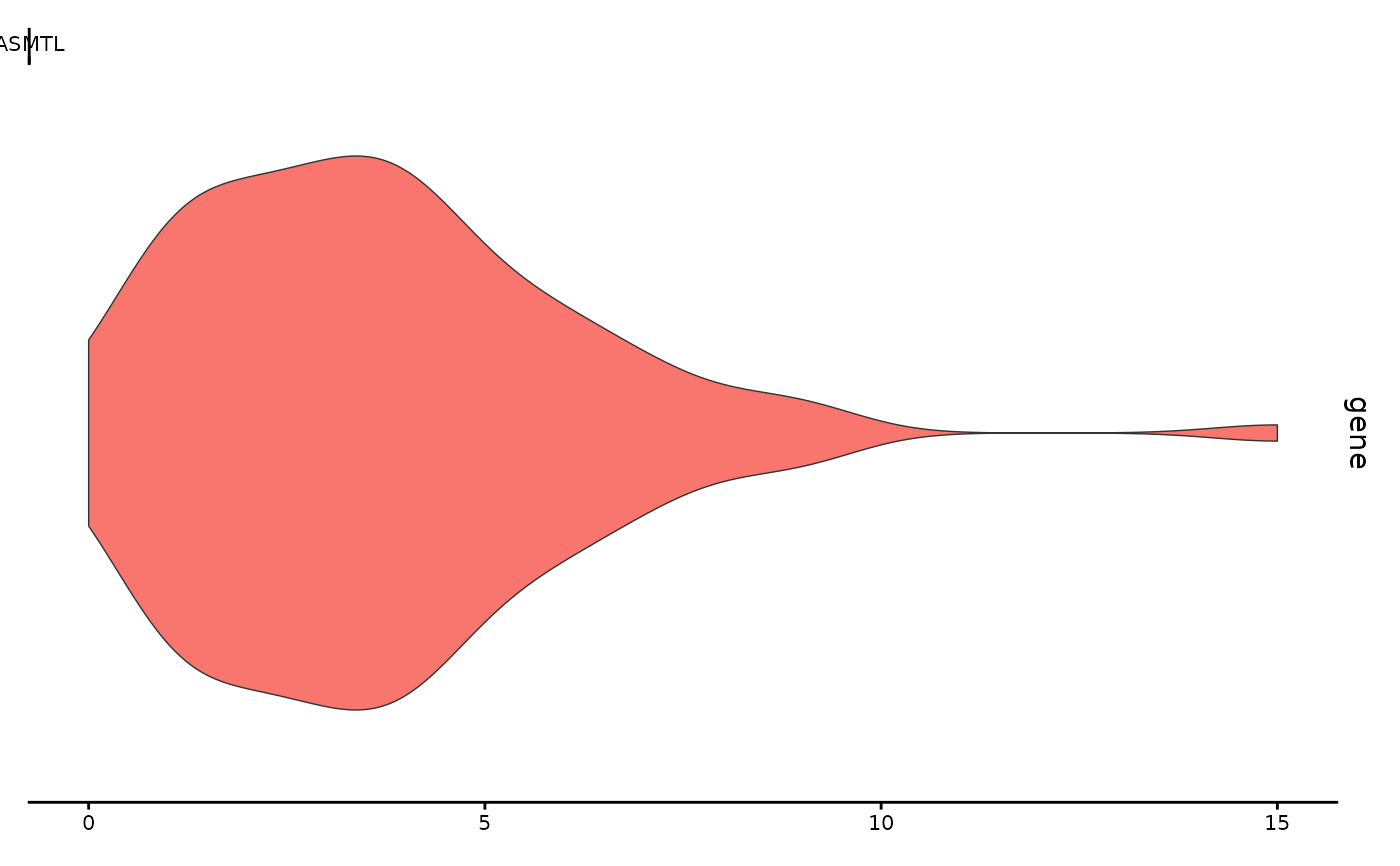
Display gene expression values for different groups of cells and different genes. Genes will be arranged on the x-axis and different groups stacked on the y-axis, with expression value distribution for each group shown as a violin plot. This is designed to work alongside a genomic coverage track, and the plot will be able to be aligned with coverage tracks for the same groups of cells.
Usage
ExpressionPlot(
  object,
  features,
  assay = NULL,
  group.by = NULL,
  idents = NULL,
  layer = "data",
  slot = deprecated()
)
Arguments
- object
A Seurat object
- features
A list of features to plot
- assay
Name of the assay storing expression information
- group.by
A grouping variable to group cells by. If NULL, use the current cell identities
- idents
A list of identities to include in the plot. If NULL, include all identities
- layer
Name of layer to pull expression data from
- slot
Which slot to pull expression data from