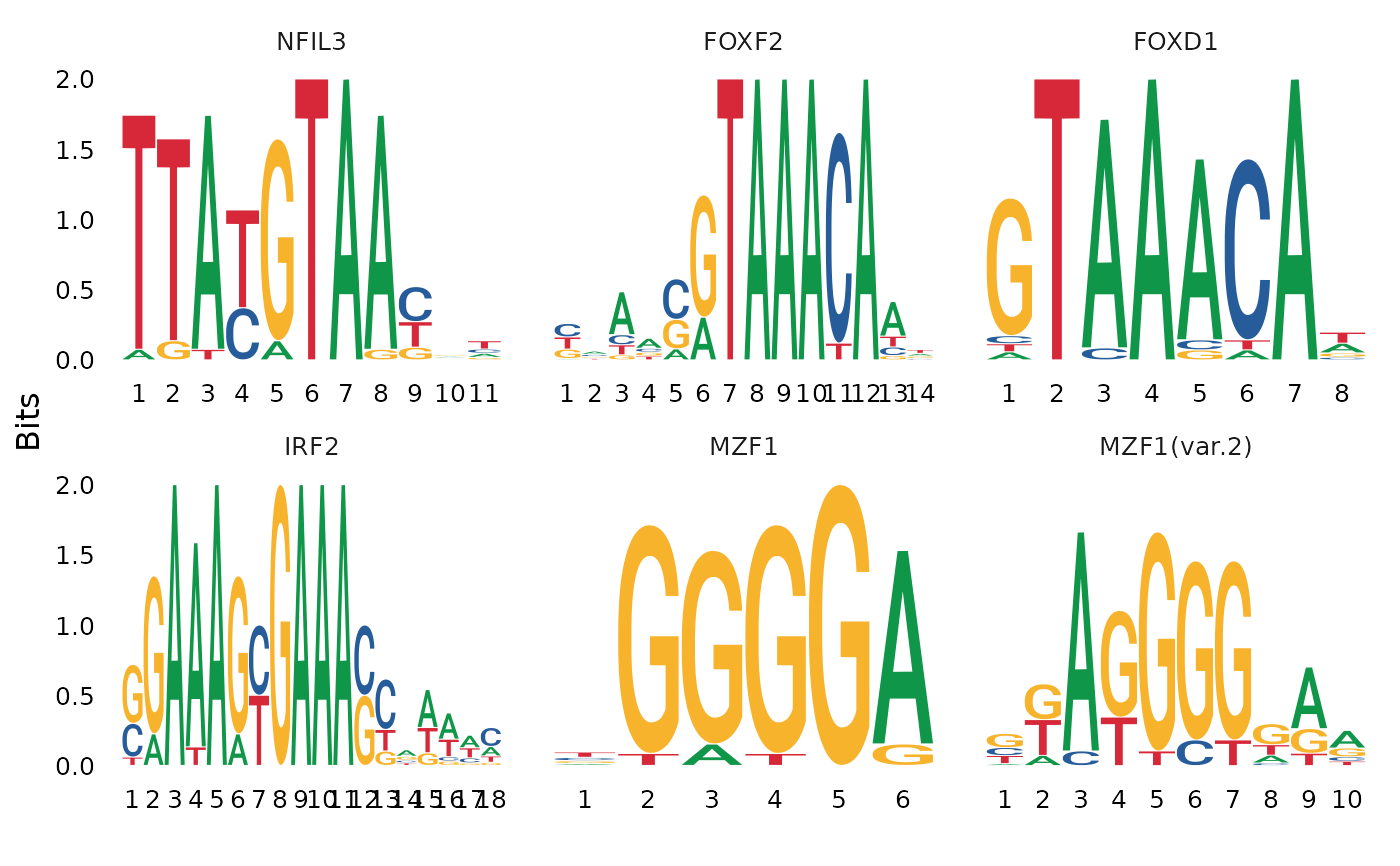
Plot position weight matrix or position frequency matrix for different DNA sequence motifs.
MotifPlot(object, motifs, assay = NULL, use.names = TRUE, ...)
Arguments
| object | A Seurat object |
|---|---|
| motifs | A list of motifs to plot |
| assay | Name of the assay to use |
| use.names | Use motif names stored in the motif object |
| ... | Additional parameters passed to |
Value
Returns a ggplot object
Examples
# \donttest{ motif.obj <- Seurat::GetAssayData(atac_small, slot = "motifs") MotifPlot(atac_small, motifs = head(colnames(motif.obj)))# }