In this tutorial, we demonstrate how to call peaks on a single-cell ATAC-seq dataset using MACS2.
To use the peak calling functionality in Signac you will first need to install MACS2. This can be done using pip or conda, or by building the package from source.
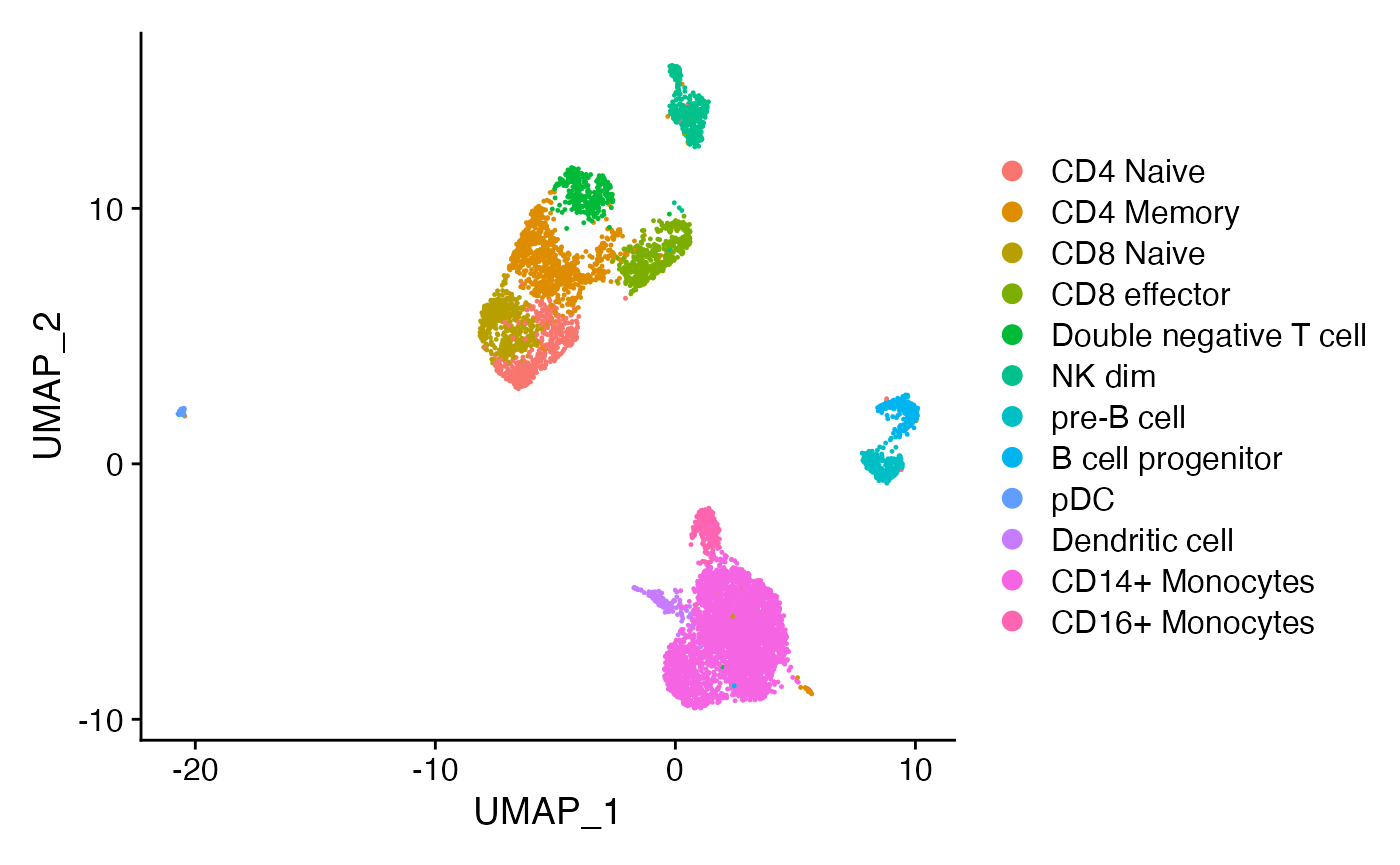
In this demonstration we use scATAC-seq data for human PBMCs. See our vignette for the code used to generate this object, and links to the raw data. First, load the required packages and the pre-computed Seurat object:
Peak calling can be performed using the CallPeaks()
function, and can either be done separately for different groups of
cells, or performed using data from all the cells. To call peaks on each
annotated cell type, we can use the group.by argument:
peaks <- CallPeaks(
  object = pbmc,
  group.by = "predicted.id"
)
The results are returned as a GRanges object, with an
additional metadata column listing the cell types that each peak was
identified in:
| seqnames | start | end | width | strand | peak_called_in |
|---|---|---|---|---|---|
| chr1 | 565196 | 565406 | 211 | * | pre-B_cell,CD14+_Monocytes,CD4_Memory,CD8_Naive |
| chr1 | 569273 | 569498 | 226 | * | Double_negative_T_cell,CD4_Naive,pre-B_cell,CD8_Naive,CD4_Memory,CD14+_Monocytes,B_cell_progenitor,CD8_effector |
| chr1 | 713483 | 714554 | 1072 | * | CD14+_Monocytes,CD8_effector,pre-B_cell,CD4_Memory,CD4_Naive,CD8_Naive,Double_negative_T_cell,B_cell_progenitor,NK_dim,CD16+_Monocytes,Dendritic_cell,pDC |
| chr1 | 752314 | 752820 | 507 | * | CD14+_Monocytes,CD16+_Monocytes,CD4_Memory,Dendritic_cell,NK_dim |
| chr1 | 762088 | 763067 | 980 | * | CD14+_Monocytes,CD4_Memory,CD4_Naive,pre-B_cell,CD8_effector,Double_negative_T_cell,CD8_Naive,CD16+_Monocytes,NK_dim,Dendritic_cell,B_cell_progenitor |
| chr1 | 779579 | 780102 | 524 | * | CD4_Memory,CD4_Naive,CD8_effector,CD8_Naive |
To quantify counts in each peak, you can use the
FeatureMatrix() function.
We can visualize the cell-type-specific MACS2 peak calls alongside
the 10x Cellranger peak calls (currently being used in the
pbmc object) with the CoveragePlot() function.
Here the Cellranger peaks are shown in grey and the MACS2 peaks in
red:
CoveragePlot(
  object = pbmc,
  region = "CD8A",
  ranges = peaks,
  ranges.title = "MACS2"
)
## Warning: Removed 1 rows containing missing values (`geom_segment()`).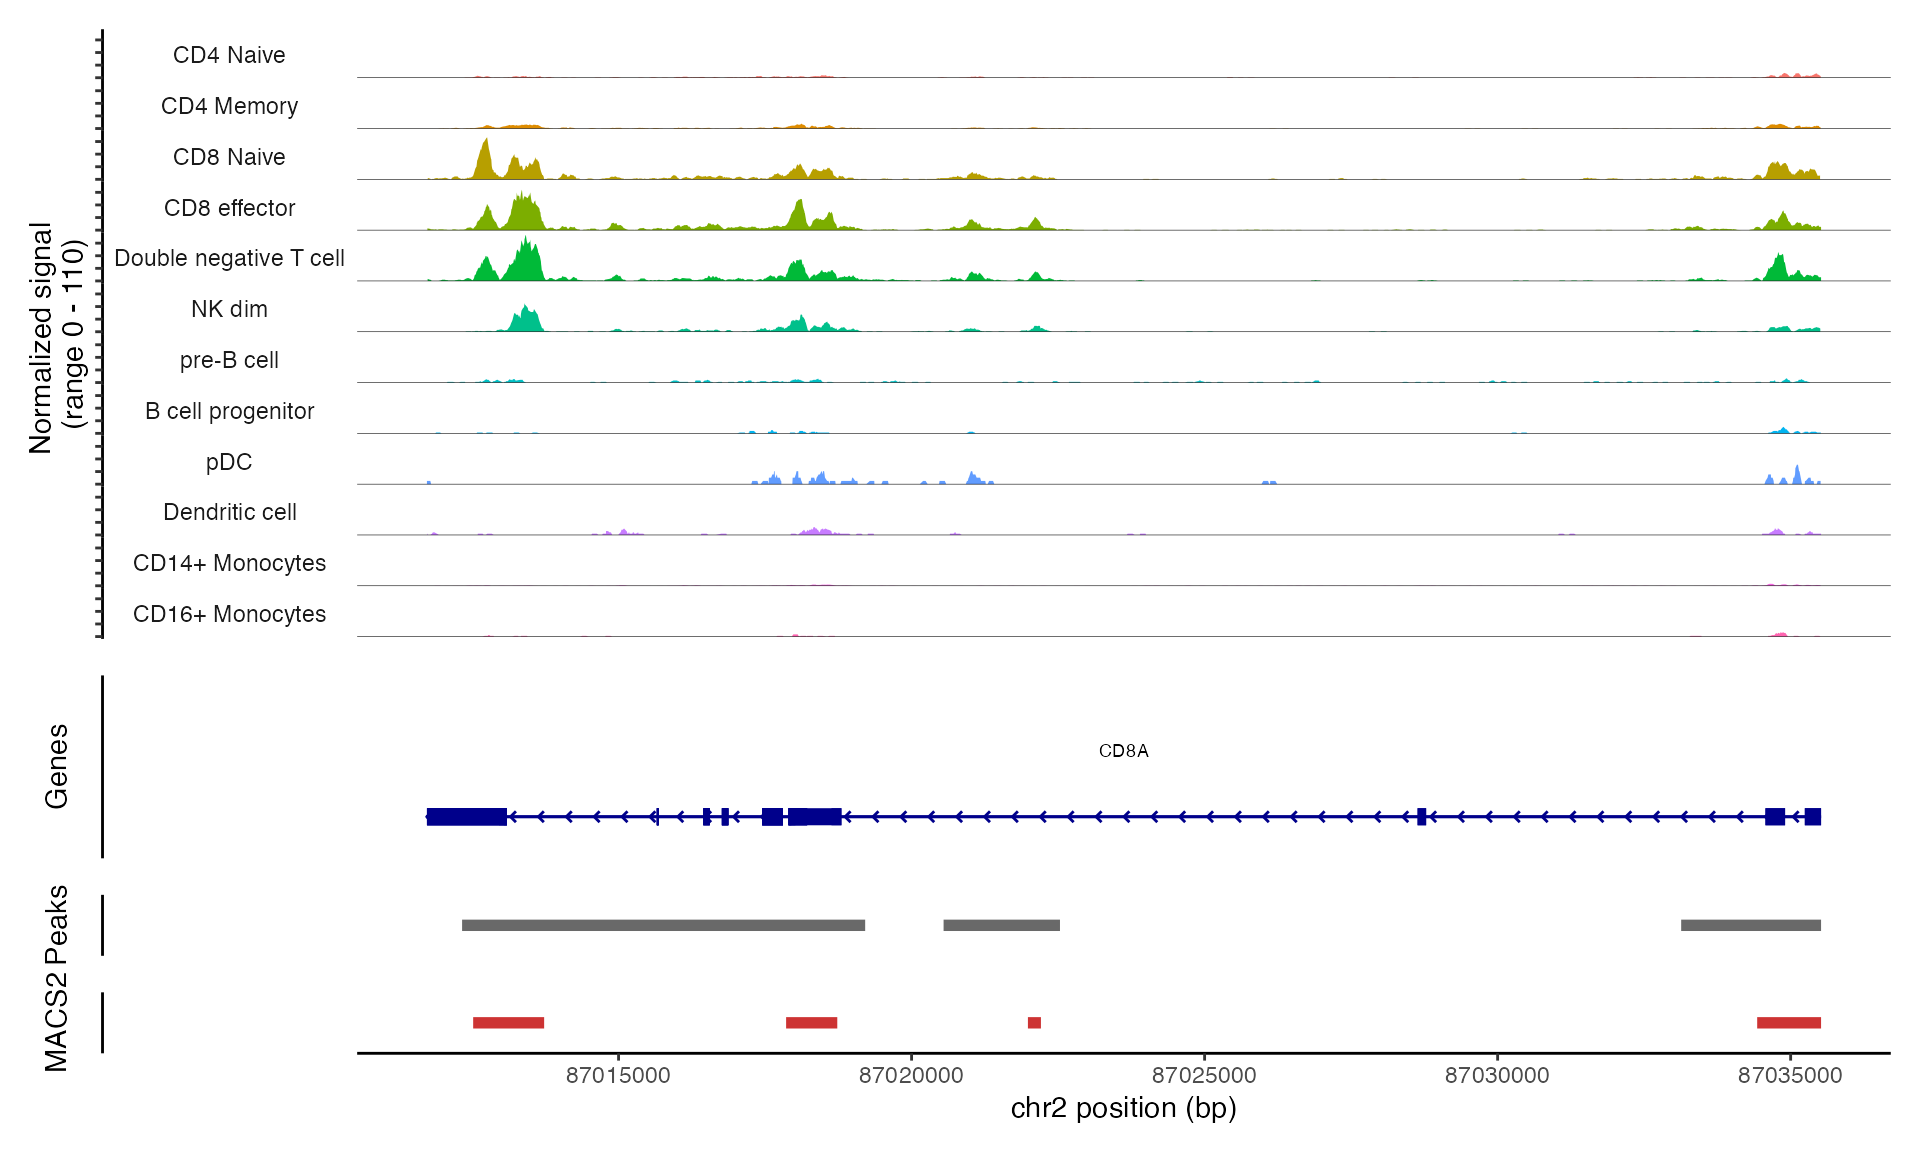
Session Info
## R version 4.3.1 (2023-06-16)
## Platform: aarch64-apple-darwin20 (64-bit)
## Running under: macOS Sonoma 14.0
##
## Matrix products: default
## BLAS:   /Library/Frameworks/R.framework/Versions/4.3-arm64/Resources/lib/libRblas.0.dylib
## LAPACK: /Library/Frameworks/R.framework/Versions/4.3-arm64/Resources/lib/libRlapack.dylib;  LAPACK version 3.11.0
##
## locale:
## [1] en_US.UTF-8/en_US.UTF-8/en_US.UTF-8/C/en_US.UTF-8/en_US.UTF-8
##
## time zone: Asia/Singapore
## tzcode source: internal
##
## attached base packages:
## [1] stats     graphics  grDevices utils     datasets  methods   base
##
## other attached packages:
## [1] SeuratObject_4.1.4 Seurat_4.4.0       Signac_1.11.0
##
## loaded via a namespace (and not attached):
##   [1] RColorBrewer_1.1-3      rstudioapi_0.15.0       jsonlite_1.8.7
##   [4] magrittr_2.0.3          spatstat.utils_3.0-3    farver_2.1.1
##   [7] rmarkdown_2.25          fs_1.6.3                zlibbioc_1.46.0
##  [10] ragg_1.2.6              vctrs_0.6.3             ROCR_1.0-11
##  [13] memoise_2.0.1           spatstat.explore_3.2-3  Rsamtools_2.16.0
##  [16] RCurl_1.98-1.12         RcppRoll_0.3.0          htmltools_0.5.6.1
##  [19] sass_0.4.7              sctransform_0.4.0       parallelly_1.36.0
##  [22] KernSmooth_2.23-21      bslib_0.5.1             htmlwidgets_1.6.2
##  [25] desc_1.4.2              ica_1.0-3               plyr_1.8.9
##  [28] plotly_4.10.2           zoo_1.8-12              cachem_1.0.8
##  [31] igraph_1.5.1            mime_0.12               lifecycle_1.0.3
##  [34] pkgconfig_2.0.3         Matrix_1.6-1.1          R6_2.5.1
##  [37] fastmap_1.1.1           GenomeInfoDbData_1.2.10 fitdistrplus_1.1-11
##  [40] future_1.33.0           shiny_1.7.5             digest_0.6.33
##  [43] colorspace_2.1-0        patchwork_1.1.3         S4Vectors_0.38.2
##  [46] tensor_1.5              rprojroot_2.0.3         irlba_2.3.5.1
##  [49] textshaping_0.3.7       GenomicRanges_1.52.0    labeling_0.4.3
##  [52] progressr_0.14.0        spatstat.sparse_3.0-2   fansi_1.0.5
##  [55] polyclip_1.10-6         abind_1.4-5             httr_1.4.7
##  [58] compiler_4.3.1          withr_2.5.1             BiocParallel_1.34.2
##  [61] MASS_7.3-60             tools_4.3.1             lmtest_0.9-40
##  [64] httpuv_1.6.11           future.apply_1.11.0     goftest_1.2-3
##  [67] glue_1.6.2              nlme_3.1-162            promises_1.2.1
##  [70] grid_4.3.1              Rtsne_0.16              cluster_2.1.4
##  [73] reshape2_1.4.4          generics_0.1.3          gtable_0.3.4
##  [76] spatstat.data_3.0-1     tidyr_1.3.0             data.table_1.14.8
##  [79] sp_2.1-0                utf8_1.2.3              XVector_0.40.0
##  [82] spatstat.geom_3.2-5     BiocGenerics_0.46.0     RcppAnnoy_0.0.21
##  [85] ggrepel_0.9.3           RANN_2.6.1              pillar_1.9.0
##  [88] stringr_1.5.0           later_1.3.1             splines_4.3.1
##  [91] dplyr_1.1.3             lattice_0.21-8          deldir_1.0-9
##  [94] survival_3.5-5          tidyselect_1.2.0        Biostrings_2.68.1
##  [97] miniUI_0.1.1.1          pbapply_1.7-2           knitr_1.44
## [100] gridExtra_2.3           IRanges_2.34.1          scattermore_1.2
## [103] stats4_4.3.1            xfun_0.40               matrixStats_1.0.0
## [106] stringi_1.7.12          lazyeval_0.2.2          yaml_2.3.7
## [109] evaluate_0.22           codetools_0.2-19        tibble_3.2.1
## [112] cli_3.6.1               uwot_0.1.16             xtable_1.8-4
## [115] reticulate_1.32.0       systemfonts_1.0.5       munsell_0.5.0
## [118] jquerylib_0.1.4         Rcpp_1.0.11             GenomeInfoDb_1.36.3
## [121] spatstat.random_3.1-6   globals_0.16.2          png_0.1-8
## [124] parallel_4.3.1          ellipsis_0.3.2          pkgdown_2.0.7
## [127] ggplot2_3.4.4           bitops_1.0-7            listenv_0.9.0
## [130] viridisLite_0.4.2       scales_1.2.1            ggridges_0.5.4
## [133] leiden_0.4.3            purrr_1.0.2             crayon_1.5.2
## [136] rlang_1.1.1             cowplot_1.1.1           fastmatch_1.1-4