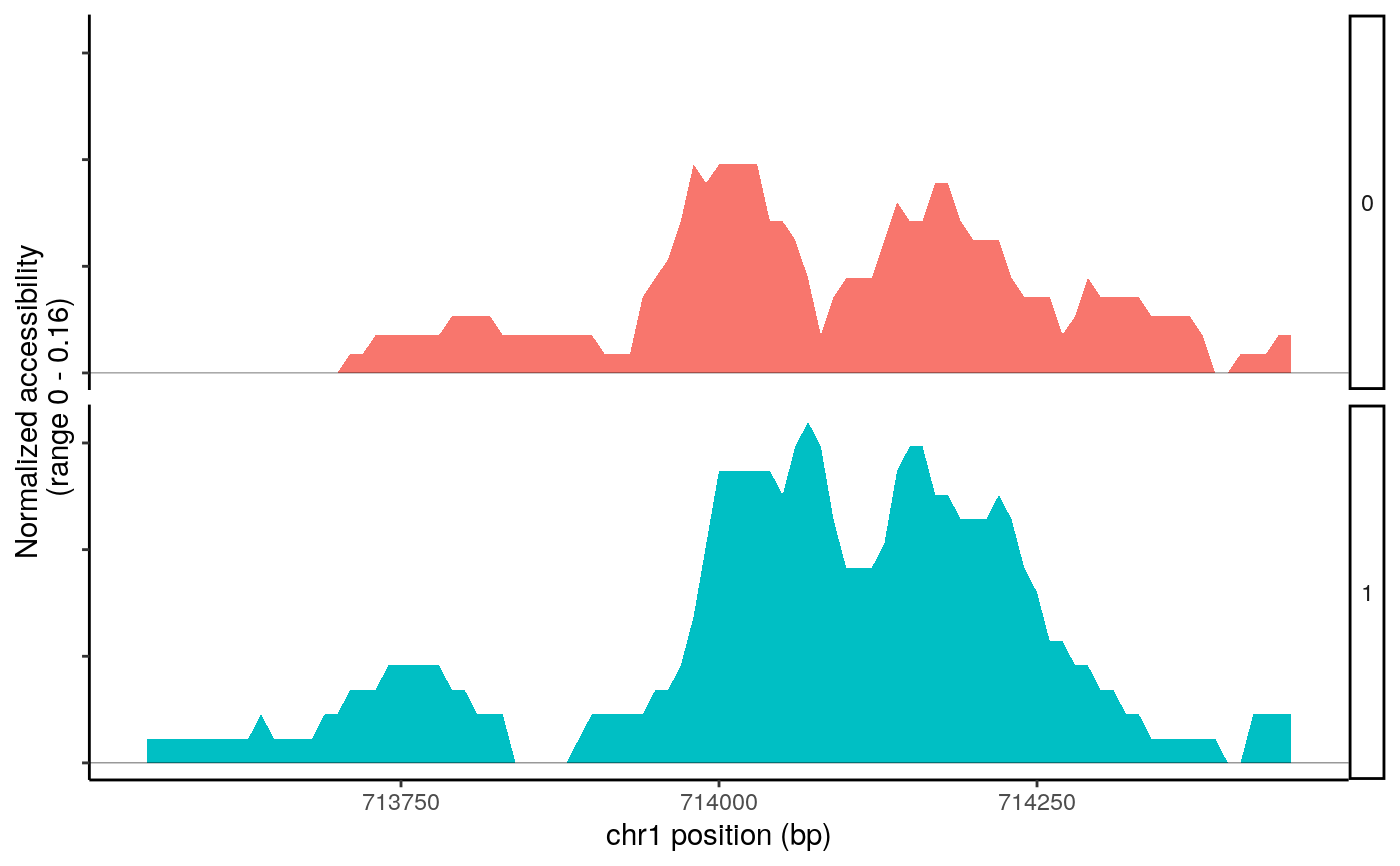
Plot fragment coverage (frequence of Tn5 insertion) within given regions for groups of cells.
SingleCoveragePlot(
  object,
  region,
  annotation = NULL,
  peaks = NULL,
  assay = NULL,
  fragment.path = NULL,
  group.by = NULL,
  window = 100,
  downsample = 0.1,
  height.tracks = 10,
  extend.upstream = 0,
  extend.downstream = 0,
  ymax = NULL,
  scale.factor = NULL,
  cells = NULL,
  idents = NULL,
  sep = c("-", "-")
)

CoveragePlot(
  object,
  region,
  annotation = NULL,
  peaks = NULL,
  assay = NULL,
  fragment.path = NULL,
  group.by = NULL,
  window = 100,
  downsample = 0.1,
  height.tracks = 10,
  extend.upstream = 0,
  extend.downstream = 0,
  scale.factor = NULL,
  ymax = NULL,
  cells = NULL,
  idents = NULL,
  sep = c("-", "-"),
  ...
)
Arguments
| object | A Seurat object |
|---|---|
| region | A set of genomic coordinates to show. Can be a GRanges object, a string, or a vector of strings describing the genomic coordinates to plot. |
| annotation | An Ensembl based annotation package |
| peaks | A GRanges object containing peak coordinates |
| assay | Name of the assay to plot |
| fragment.path | Path to an index fragment file. If NULL, will look for a
path stored for the requested assay using the |
| group.by | Name of one or more metadata columns to group (color) the cells by. Default is the current cell identities |
| window | Smoothing window size |
| downsample | Fraction of positions to retain in the plot. |
| height.tracks | Height of the accessibility tracks relative to the height of the gene annotation track. |
| extend.upstream | Number of bases to extend the region upstream. |
| extend.downstream | Number of bases to extend the region downstream. |
| ymax | Maximum value for Y axis. If NULL (default) set to the highest value among all the tracks. |
| scale.factor | Scaling factor for track height. If NULL (default), use the median group scaling factor determined by total number of fragments sequences in each group. |
| cells | Which cells to plot. Default all cells |
| idents | Which identities to include in the plot. Default is all identities. |
| sep | Separators to use for strings encoding genomic coordinates. First element is used to separate the chromosome from the coordinates, second element is used to separate the start from end coordinate. |
| ... | Additional arguments passed to |
Value
Returns a ggplot object
Details
Thanks to Andrew Hill for providing an early version of this function http://andrewjohnhill.com/blog/2019/04/12/streamlining-scatac-seq-visualization-and-analysis/
Examples
# \donttest{
fpath <- system.file("extdata", "fragments.tsv.gz", package="Signac")
atac_small <- SetFragments(atac_small, file = fpath)
CoveragePlot(object = atac_small, region = c("chr1-713500-714500"))# }