Theme applied to panels in the CoveragePlot function.
theme_browser(..., legend = TRUE, axis.text.y = FALSE)Examples
# \donttest{
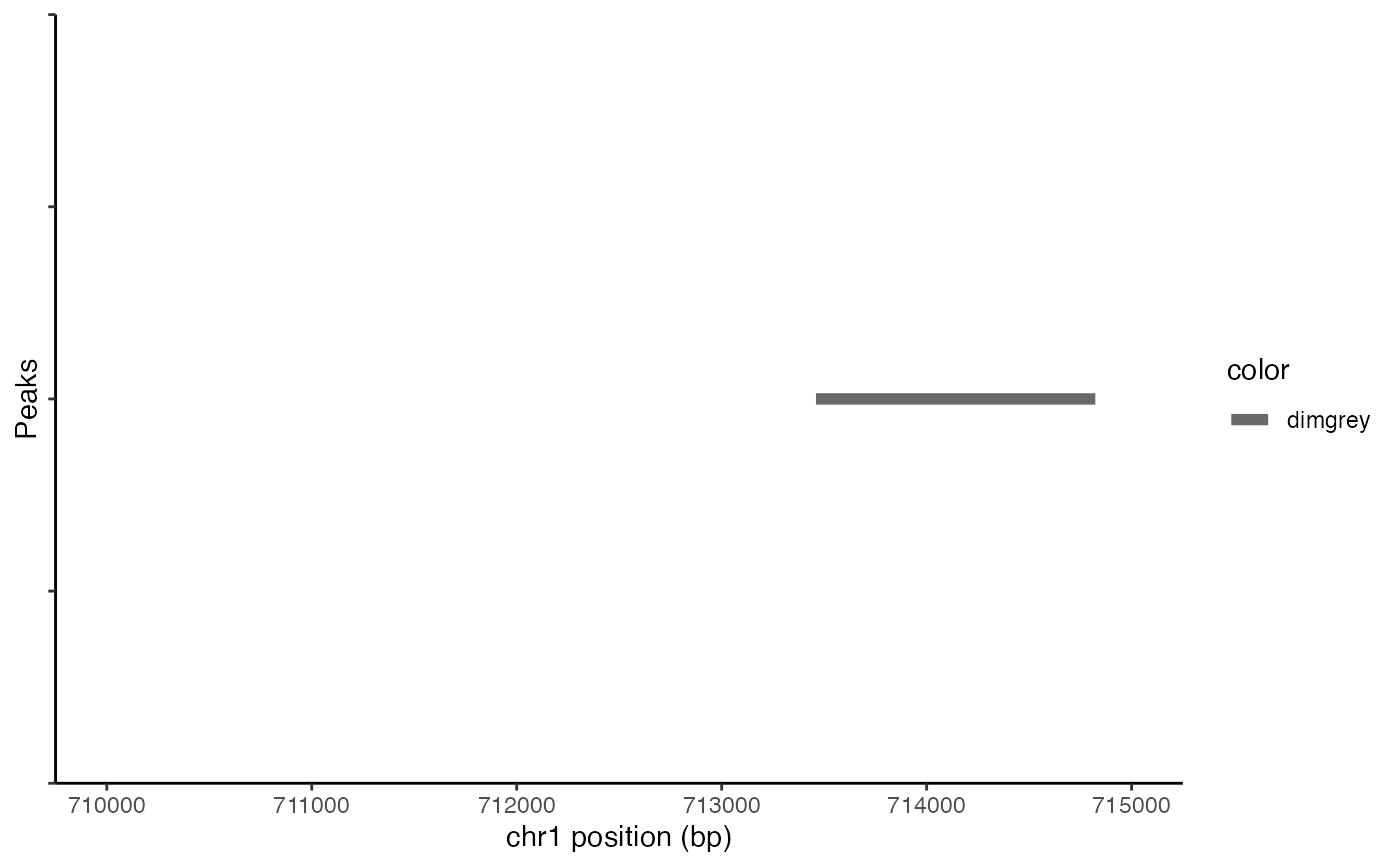
PeakPlot(atac_small, region = "chr1-710000-715000") + theme_browser()

# }
# }
Theme applied to panels in the CoveragePlot function.
theme_browser(..., legend = TRUE, axis.text.y = FALSE)# \donttest{
PeakPlot(atac_small, region = "chr1-710000-715000") + theme_browser()
 # }
# }