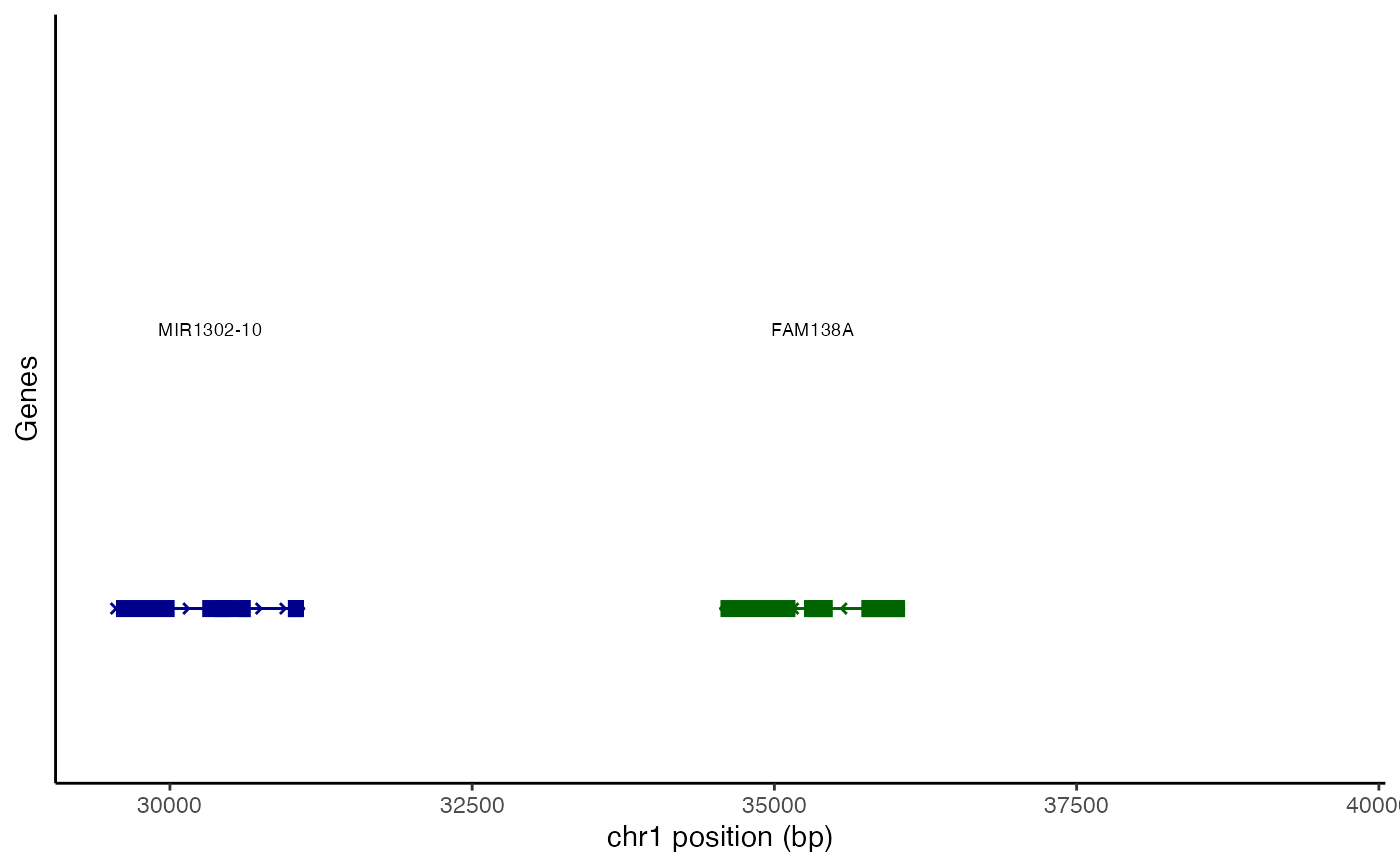
Display gene annotations in a given region of the genome.
AnnotationPlot(
  object,
  region,
  assay = NULL,
  mode = "gene",
  sep = c("-", "-"),
  extend.upstream = 0,
  extend.downstream = 0
)
Arguments
- object
A
SeuratObject::Seurat()object- region
A genomic region to plot
- assay
Name of assay to use. If NULL, use the default assay.
- mode
Display mode. Choose either "gene" or "transcript" to determine whether genes or transcripts are plotted.
- sep
Separators to use for strings encoding genomic coordinates. First element is used to separate the chromosome from the coordinates, second element is used to separate the start from end coordinate.
- extend.upstream
Number of bases to extend the region upstream.
- extend.downstream
Number of bases to extend the region downstream.
Value
Returns a ggplot2::ggplot() object
Examples
# \donttest{
AnnotationPlot(object = atac_small, region = c("chr1-29554-39554"))
#> Warning: `aes_string()` was deprecated in ggplot2 3.0.0.
#> ℹ Please use tidy evaluation idioms with `aes()`.
#> ℹ See also `vignette("ggplot2-in-packages")` for more information.
#> ℹ The deprecated feature was likely used in the Signac package.
#>   Please report the issue at <https://github.com/stuart-lab/signac/issues>.
#> Warning: Using `size` aesthetic for lines was deprecated in ggplot2 3.4.0.
#> ℹ Please use `linewidth` instead.
#> ℹ The deprecated feature was likely used in the Signac package.
#>   Please report the issue at <https://github.com/stuart-lab/signac/issues>.

# }
# }