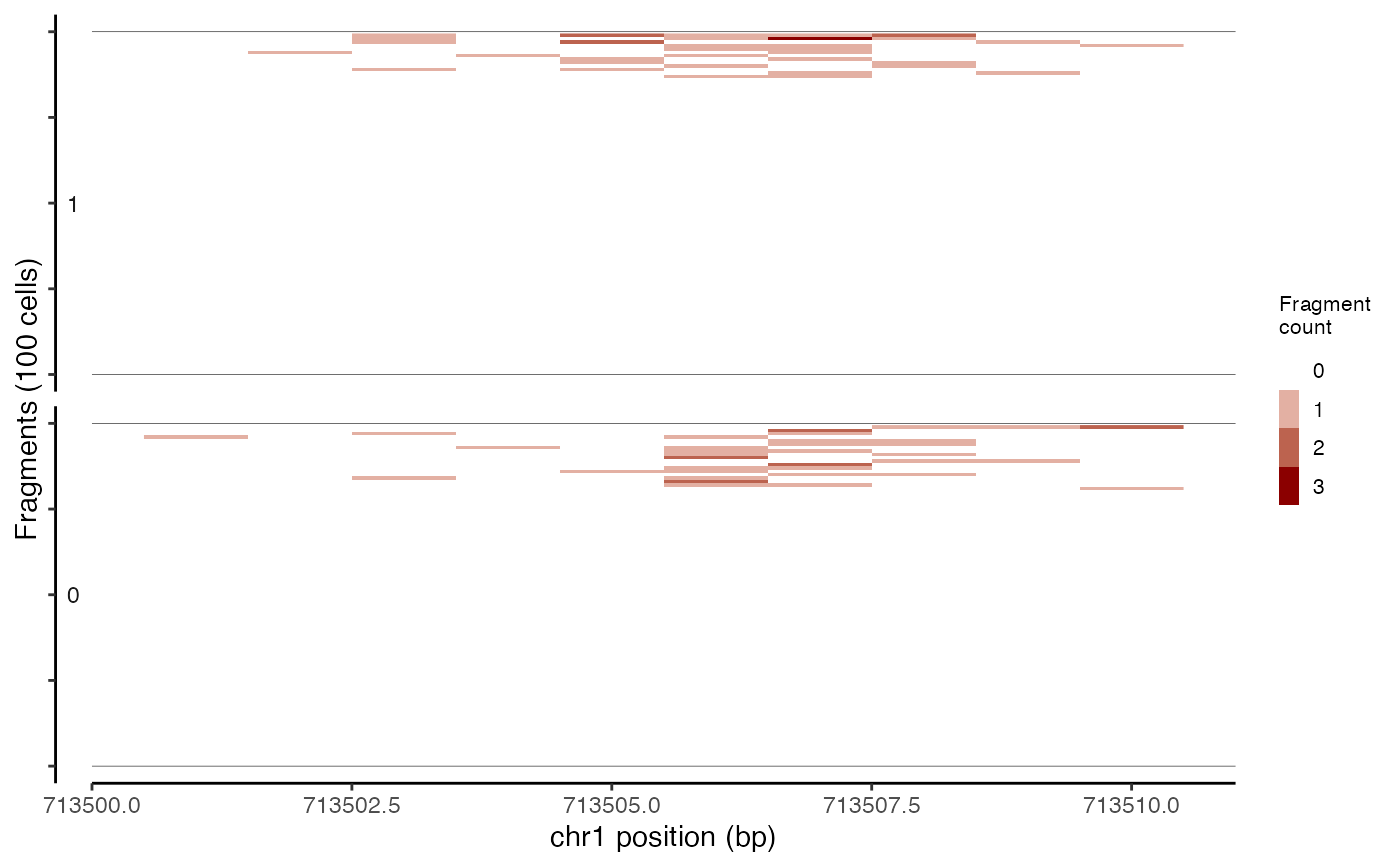
Plots the presence/absence of Tn5 integration sites for each cell within a genomic region.
TilePlot(
  object,
  region,
  sep = c("-", "-"),
  tile.size = 100,
  tile.cells = 100,
  extend.upstream = 0,
  extend.downstream = 0,
  assay = NULL,
  cells = NULL,
  group.by = NULL,
  order.by = "total",
  idents = NULL
)
Arguments
- object
A Seurat object
- region
A set of genomic coordinates to show. Can be a GRanges object, a string encoding a genomic position, a gene name, or a vector of strings describing the genomic coordinates or gene names to plot. If a gene name is supplied, annotations must be present in the assay.
- sep
Separators to use for strings encoding genomic coordinates. First element is used to separate the chromosome from the coordinates, second element is used to separate the start from end coordinate.
- tile.size
Size of the sliding window for per-cell fragment tile plot
- tile.cells
Number of cells to display fragment information for in tile plot.
- extend.upstream
Number of bases to extend the region upstream.
- extend.downstream
Number of bases to extend the region downstream.
- assay
Name of assay to use
- cells
Which cells to plot. Default all cells
- group.by
Name of grouping variable to group cells by. If NULL, use the current cell identities
- order.by
Option for determining how cells are chosen from each group. Options are "total" or "random". "total" will select the top cells based on total number of fragments in the region, "random" will select randomly.
- idents
List of cell identities to include in the plot. If NULL, use all identities.
Value
Returns a ggplot object
Examples
# \donttest{
fpath <- system.file("extdata", "fragments.tsv.gz", package="Signac")
fragments <- CreateFragmentObject(
  path = fpath,
  cells = colnames(atac_small),
  validate.fragments = FALSE
)
#> Computing hash
Fragments(atac_small) <- fragments
TilePlot(object = atac_small, region = c("chr1-713500-714500"))

# }
# }